

Sarah runs a thriving online boutique. Her Google Analytics shows 50,000 visitors per month. Her conversion rate sits at a respectable 2.5%. With an average order value of $75, she generates $93,750 in monthly revenue.
Not bad, right?
But here's what Sarah doesn't know: Her site loads in 5 seconds. Industry research shows that if her site loaded in just 2 seconds instead, her conversion rate would jump to 3.4%—a 36% increase.
Let's do the math:
• Current monthly revenue: $93,750
• Potential monthly revenue (at 3.4%): $127,500
Money left on the table: $33,750 per month
Annual opportunity cost: $405,000
Sarah is losing nearly half a million dollars per year because of 3 extra seconds of load time. And she has no idea it's happening.
The brutal truth?
4.42%
Every second of delay in page load time costs you 4.42% in conversions
For most businesses, that's tens or hundreds of thousands in lost annual revenue
The Speed-to-Money Connection
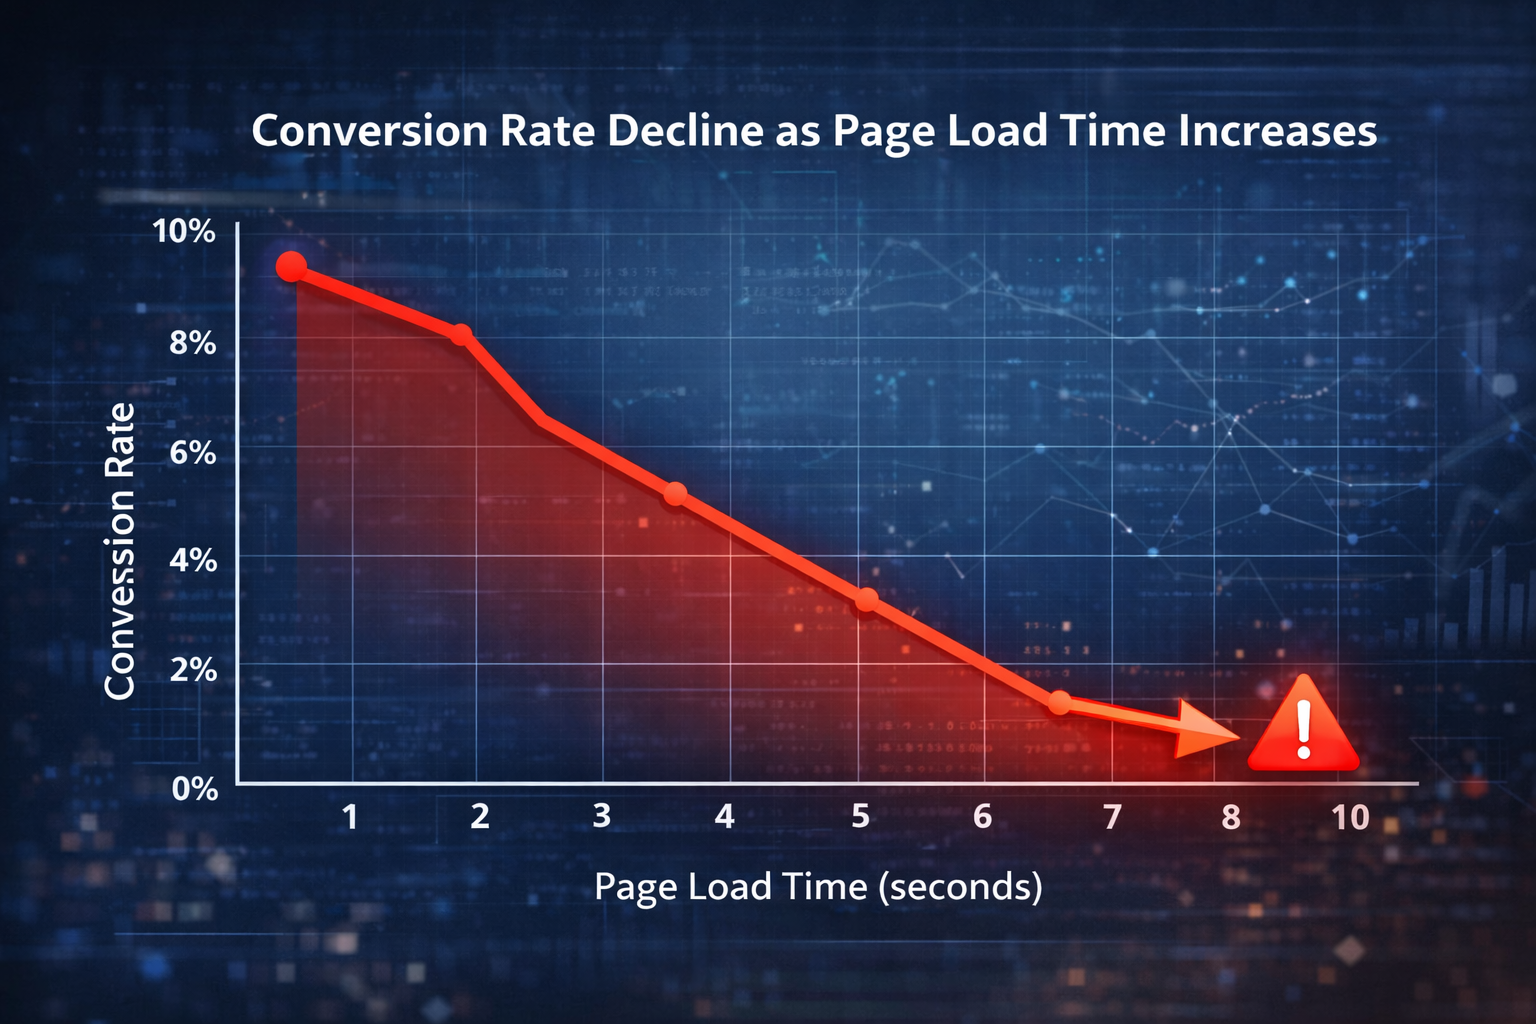 Graph showing conversion rate declining as page load time increases
The Core Statistics:
1 second load time
Sites loading this fast convert at
39%
3 seconds load time
Conversion drops to (25.6% decline)
29%
5 seconds load time
Conversion plummets to (48.7% decline)
20%
Put simply:
A site that loads in 1 second has a conversion rate 2.5x higher than a site that loads in 5 seconds
SMALL E-COMMERCE
• Monthly visitors: 10,000
• Current load: 5 seconds
• Current conversion: 2%
• Average order: $75
Current revenue: $15,000/mo
After optimization to 2 seconds:
New conversion: 2.73%
New revenue: $20,475/mo
Annual Gain:
$65,700
MEDIUM ONLINE STORE
• Monthly visitors: 50,000
• Current load: 4 seconds
• Current conversion: 2.5%
• Average order: $100
Current revenue: $125,000/mo
After optimization to 1.5 seconds:
New conversion: 3.28%
New revenue: $164,000/mo
Annual Gain:
$468,000
LARGE SERVICE BUSINESS
• Monthly visitors: 100,000
• Current load: 6 seconds
• Current conversion: 3%
• Customer value: $200
Current revenue: $600,000/mo
After optimization to 2 seconds:
New conversion: 4.47%
New revenue: $894,000/mo
Annual Gain:
$3.5M
The Mobile Speed Crisis
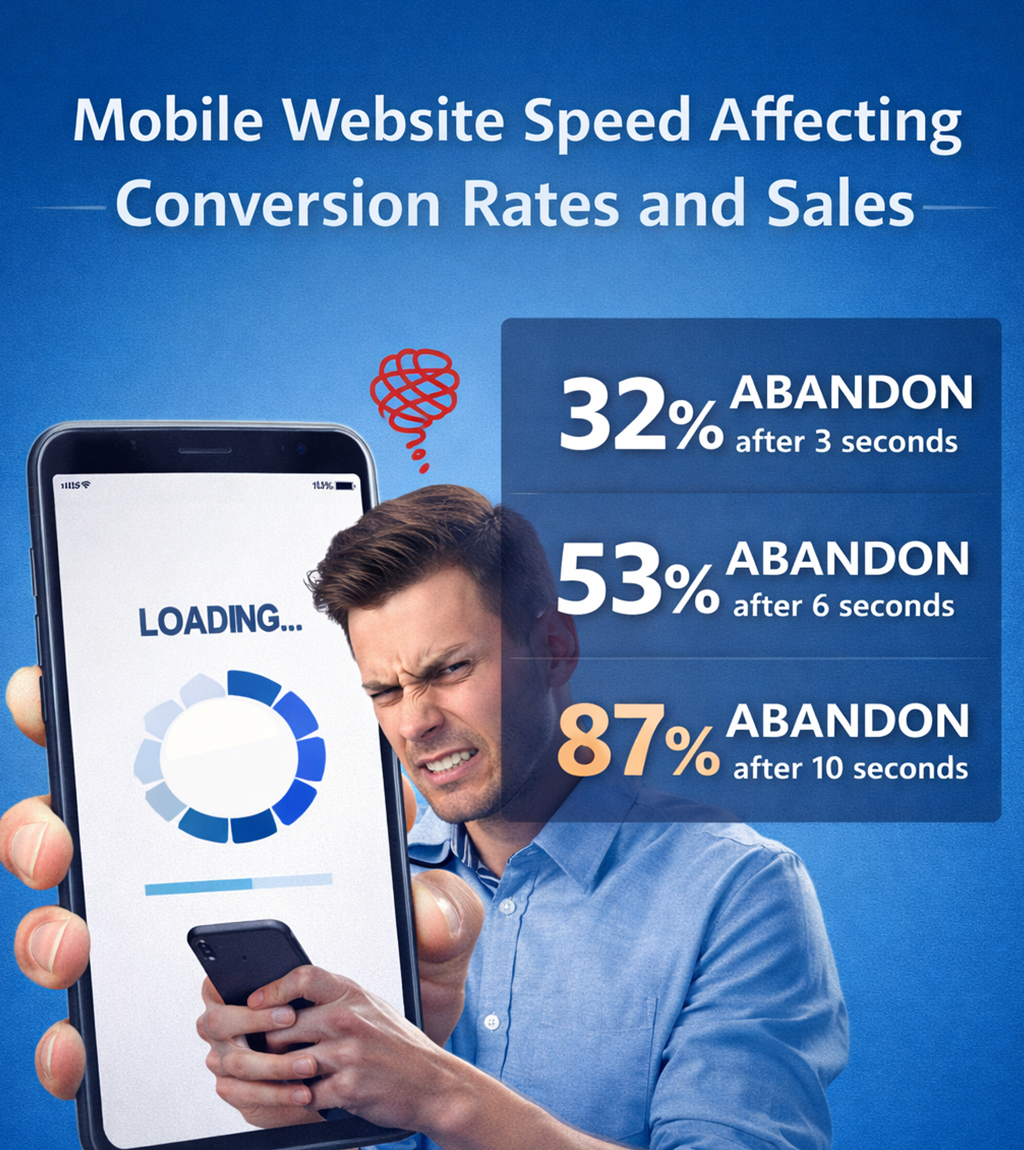
Mobile commerce now accounts for:
59%
of all web traffic
Yet pages take 87.8% longer to load on mobile than desktop
The Mobile Statistics:
53% of mobile users abandon sites taking longer than 3 seconds
79% of shoppers dissatisfied with mobile performance won't return
A 1-second delay in mobile load time impacts conversions by up to 20%
Mobile Revenue Impact Example:
Mobile visitors/month:
30,000
Current mobile revenue:
$33,750/mo
After optimization:
$41,213/mo
Annual gain:
$89,556
The Breaking Point: Where Do You Stand?
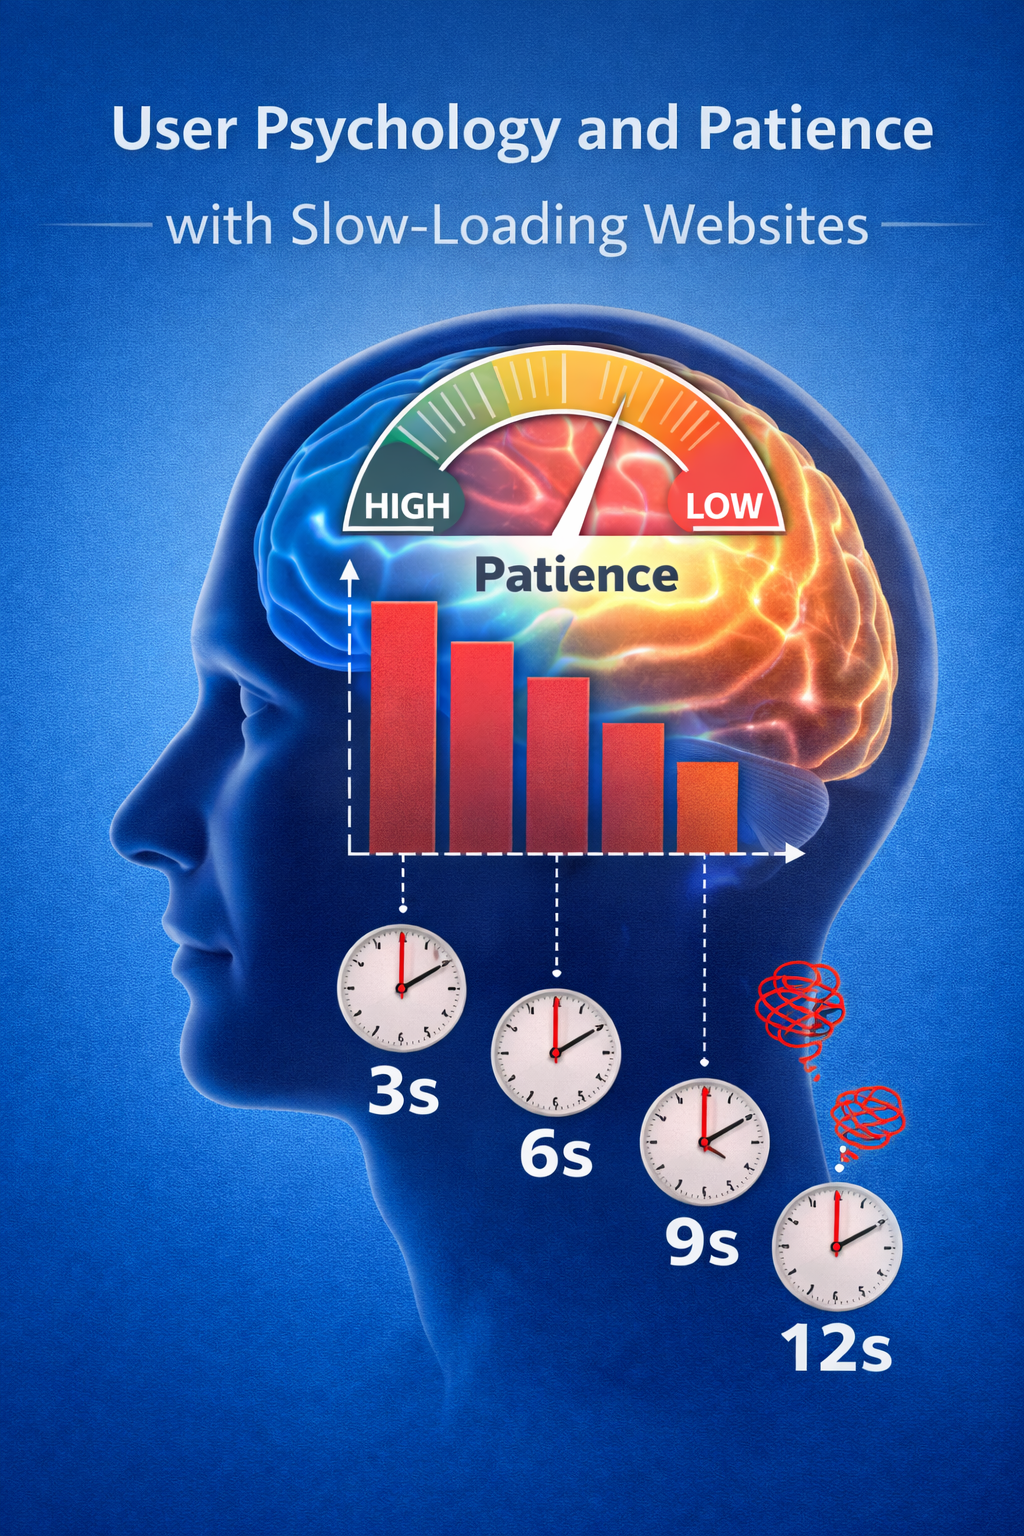
Elite Zone
0-1 sec
Conversion: 39% • Bounce: 7% • Perception: "Professional, premium" • Advantage: MASSIVE
Optimal Zone
1-2 sec
Conversion: 34-39% • Bounce: 9% • Perception: "Fast, reliable" • This is where you want to be
Warning Zone
3-5 sec
Conversion: 20-29% • Bounce: 32-38% • Perception: "Slow" • You're actively losing money
Danger Zone
5-8 sec
Conversion: 18-20% • Bounce: 38-60% • Perception: "Is this broken?" • You're bleeding money FAST
Critical Failure
8+ sec
Conversion: 0.5-1% • Bounce: 60%+ • Perception: "Unusable" • Your business is in CRISIS
5 Quick Wins for Immediate Speed
These fixes deliver 40-70% speed improvement in hours, not months
1
Image Optimization
30-50% Speed Improvement
Images account for 60%+ of page weight. Most sites use images 5-10x larger than necessary.
⏱️ Time: 1-2 hours
💰 Cost: $0-$50/year
🎯 Tools: Smush, ShortPixel, Imagify
2
Enable Caching
40-60% Speed Improvement
Caching stores static versions of pages so they load instantly instead of generating from scratch every time.
⏱️ Time: 30 minutes
💰 Cost: $0-$50/year
🎯 Tools: WP Rocket, W3 Total Cache
3
Use a CDN
20-40% Global Speed Boost
Content Delivery Networks serve your files from 200+ locations worldwide, dramatically improving global speed.
⏱️ Time: 1 hour
💰 Cost: $0-$20/month
🎯 Tools: Cloudflare (free tier)
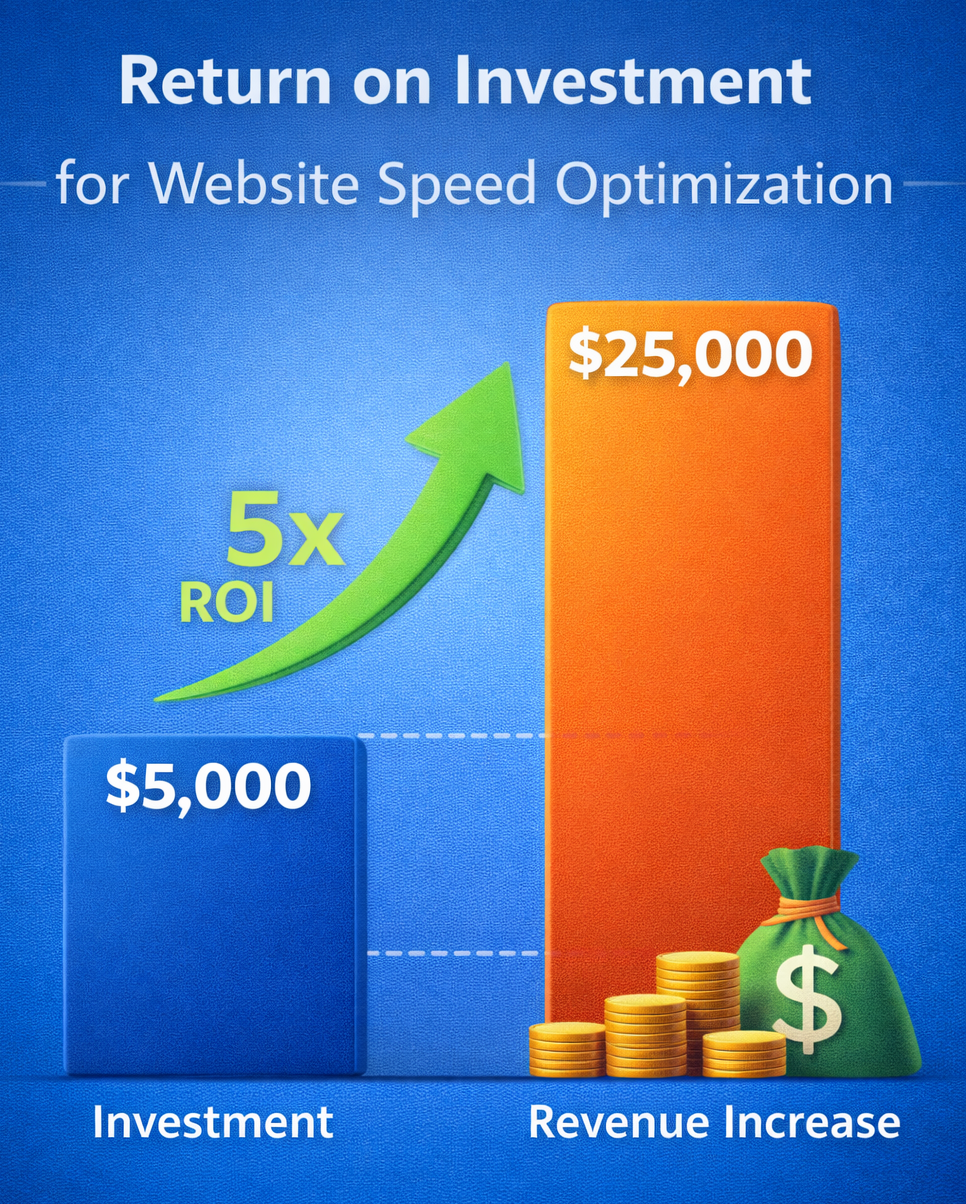
The ROI That Justifies Everything
Small E-Commerce
Revenue: $180,000/year
Optimization cost: $2,500
Revenue increase: $31,824/year
ROI:
1,173%
Payback: 28 days
Medium Business
Revenue: $1,000,000/year
Optimization cost: $4,000
Revenue increase: $132,600/year
ROI:
3,215%
Payback: 11 days
Large Business
Revenue: $10,000,000/year
Optimization cost: $15,000
Revenue increase: $1,105,000/year
ROI:
7,267%
Payback: 5 days
For every dollar spent on speed optimization...
You save $21-$67 in prevented losses
Free Speed Audit
Get Your FREE Speed Audit & Revenue Report
Discover exactly how much money your slow site is costing you
What You Get (100% Free):
🔍
Speed Analysis
Desktop + Mobile
💰
Revenue Impact
Your exact losses
⚡
Action Plan
Prioritized fixes
📊
ROI Forecast
Expected gains
⏰ Limited: Only 10 comprehensive audits per week
Response within 24-48 hours • No obligation • No sales pressure
What Our Clients Say
★★★★★
"The audit showed I was losing $4,200 per month. After optimization, my revenue jumped 23% in the first month alone."
Jessica M.
Online Boutique Owner
★★★★★
"We were losing $180K annually. Fixed it in 3 weeks and tracked a $14K revenue increase the next month."
David K.
E-Commerce Director
★★★★★
"42% of mobile visitors were bouncing. That's nearly $300K/year we didn't know about until the audit."
Sarah T.
Marketing Director
Stop Losing Money. Start Capturing Revenue.
Every second you wait is money out of your pocket. Every day your site stays slow is a day competitors capture customers you should have won.
Calculate My Lost Revenue Now
⚡ Average speed improvement: 72% • 📈 Average revenue increase: 38% • ⏱️ Payback period: 18 days